|
HOME
Number Algebra and Graphs Algebraic Manipulation and Representation Introducing algebraic language Simplifying Expressions Expanding Expressions Factorising Expressions Evaluating expressions by Substitution Changing the Subject Combining and Simplifying Algebraic Fractions Algebraic Indices 3 Laws of Indices Zero Index Negative Indices Fractional Indices Exponential Functions Equations and Inequalities Linear Equations Constructing Equations Simultaneous Equations Inequalities Quadratic Equations Linear Programming Graphing Inequalities Linear Programming Sequences nth Term Rule Variation Direct Variation Inverse Variation Graphs in Practical Situations Conversion Graphs Difference Distance and Speed -Time graphs Distance-Time Graphs Speed-Time Graphs Acceleration and Deceleration Area under Speed-Time Graph Graphs of Functions Parabolas Graphical Solution of Quadratic Functions Reciprocal Functions Linear Functions Exponential Functions Gradient of a Curve Graphical Solution of Equations Graphing Inequalities Functions Evaluating Functions Inverse of Functions Composite Functions Geometry Mensuration Coordinate Geometry Trigonometry Vectors/Matrices/ Transformations Probability Statistics |
Graphs of Functions

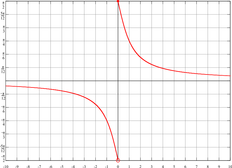
The path which the missile will travel can be described by a function. Do you know what kind of function? Can you think of more real life examples which can be captured in a graph? What about water fountains and your heart beat? Check the links below in which I will explain all you need to know about graphing functions to pass your IGCSE GCSE Maths exam. We will discuss different types of functions and I will teach you which questions you should be asking yourself when graphing a function. You will learn to identify what your graph will roughly look like by looking at the function. First I will explain to you how to graph quadratic functions (parabolas) after which I will show you how you can solve quadratic functions graphically. Then I will explain to you what reciprocal functions are and how to graph them. I will teach you what asymptotes are and why reciprocal functions look the way they do. Then we will revisit our understanding of linear functions and see what they look like when we graph them. We will discuss gradient and intercepts as we go along. Then we will look at how to graph exponential and cubic functions. You will again understand why they look the way they do when you graph them. Finally I will explain to you how to calculate the gradient of curves by drawing a tangent and how to solve different types of equations by looking at their graph. So check the links below and study all the example questions. Then you will start your maths exam prepared and with confidence. I will see you there!!
|


