|
HOME
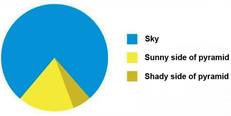
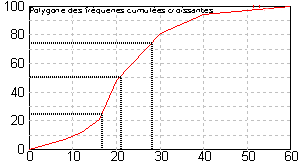
Number Algebra and Graphs Geometry Mensuration Coordinate Geometry Trigonometry Vectors, Matrices and Transformations Probability Statistics Mean, Mode, Median and Range How to find Mean, Mode, Median and Range Mean for Grouped data Collecting and Displaying data Pictograms Tally Charts and Frequency Tables Pie Charts Scatter Diagrams and Correlation Histograms Cumulative Frequency Introducing Cumulative Frequency Quartiles and the Inter-Quartile Range |
Statistics
We have several methods to say something about the average of a set of data. If you managed to get a 97%, 92%, 100%, 34%, 89% and another 34% score on your maths test, would you rather have your teacher put the mean, mode or median value of your scores your report card? In this section we will also look at ways to display data in various graphs and interpret cumulative frequency graphs. To pass your next IGCSE GCSE Maths exam you should study all the topics below regarding Statistics during your maths revision. When you study the example maths questions and still don't understand maths, let me know on the forum and I will help you. Good luck and have fun!
|