|
HOME
Number Algebra and Graphs Algebraic Manipulation and Representation Introducing Algebraic language Simplifying Expanding Factorising Substitution Changing the Subject Combining and Simplifying Algebraic Fractions Algebraic Indices 3 Laws of Indices Zero Index Negative Indices Fractional Indices Exponential Functions Equations and Inequalities Linear Equations Constructing Equations Simultaneous Equations Inequalities Quadratic Equations Linear Programming Graphing Inequalities Linear Programming Sequences nth Term Rule Variation Direct Variation Inverse Variation Graphs in Practical Situations Conversion Graphs Difference Distance and Speed -Time graphs Distance-Time Graphs Speed-Time Graphs Acceleration and Deceleration Area under Speed-Time Graph Graphs of Functions Parabolas Graphical Solution of Quadratic Functions Reciprocal Functions Linear Functions Exponential Functions Gradient of a Curve Graphical Solution of Equations Graphing Inequalities Functions Evaluating Functions Inverse of Functions Composite Functions Geometry Mensuration Coordinate Geometry Trigonometry Vectors/Matrices/ Transformations Probability Statistics |
How to Graph a Linear Function

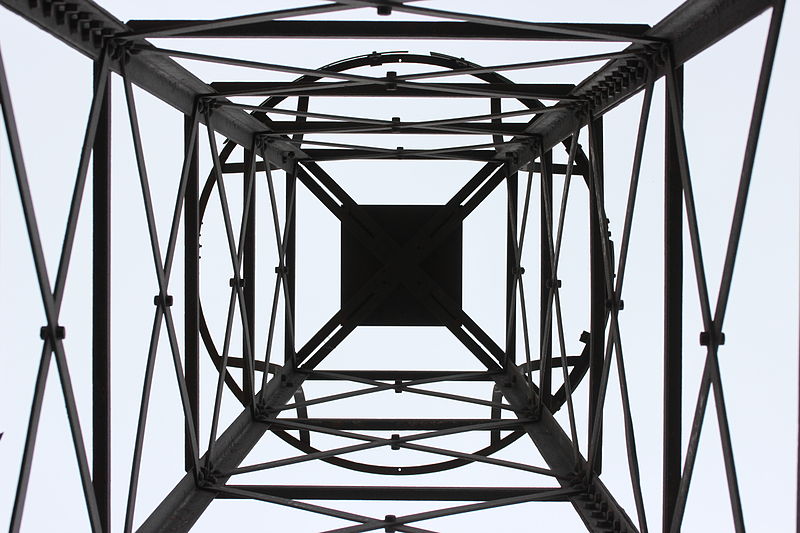
In the next example questions and maths activities I will explain to you all you need to know about graphing linear functions to pass your IGCSE GCSE Maths exam. A linear function is a function where the highest power of x is one. f(x) = 2x - 7 for instance is an example of a linear function for the highest power of x is one. When you graph a linear function you always get a line. Look at the picture on the side and the amount of lines you see in it. They can all be represented by a linear function. The line starting at the sun and going towards the text could be f(x) = -0.5x + 2. Check the next video in which I explain to you step by step how to graph and draw linear functions.
|
